prometheus部署
Prometheus是一个开源的系统监控和报警系统,与shentong_exporter结合使用,可用来监控单个或多个神通数据库的各项指标,帮助我们了解神通数据库的运行状态。
安装
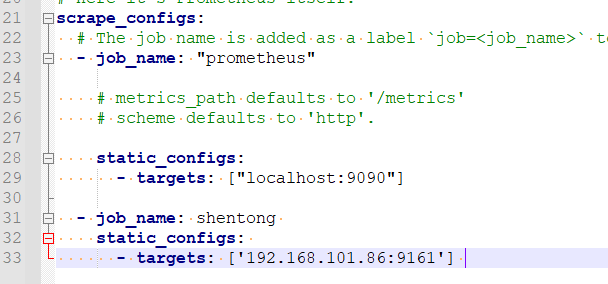
解压,进入解压后的文件夹,编辑prometheus.yml,在末尾加上prometheus监控的任务,targets里添加的是shentong_exporter的服务,我这里的主机IP是192.168.101.86。
- job_name: shentong
  static_configs:
    - targets: ['192.168.101.86:9161']
添加完成后如下图:
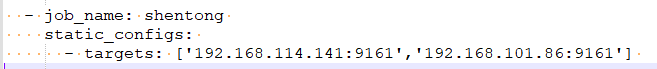
prometheus.yml这里监控的单个神通数据库,如果需要监控多个神通数据库时,在targets中的数组里增加shentong_exporter。 如图:
启动prometheus
prometheus的默认端口是9090,启动命令:
nohup ./prometheus --config.file="prometheus.yml" &
如果需要使用其他端口,用下列命令来指定端口:
nohup./prometheus --config.file="prometheus.yml" --web.listen-address=:9091 &
检验prometheus是否启动成功,在浏览器里输入地址:http://192.168.101.86:9090/targets,看到下列网页,则说明prometheus服务已经搭建好。
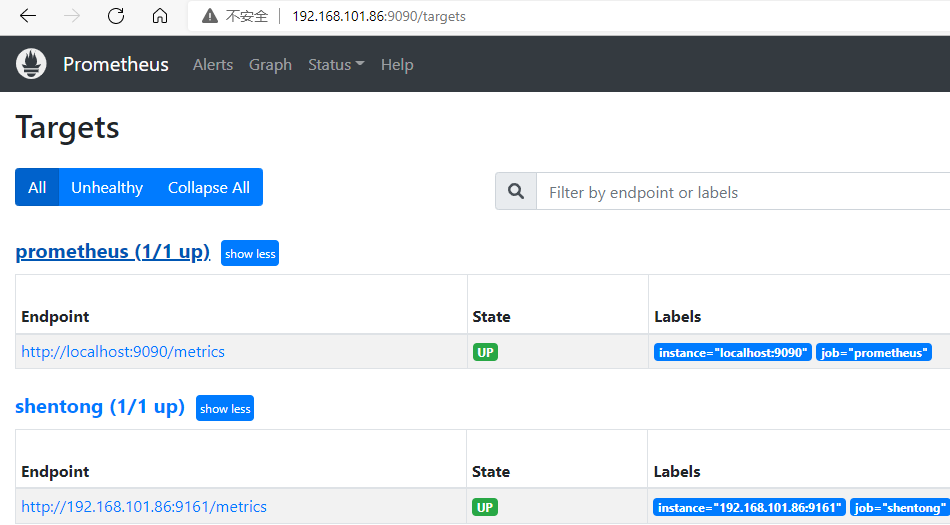
提示
图中有2个job,其中prometheus是prometheus.yml中默认配置的任务,用来监控prometheus自身的运行状态,而shentong任务是前面步骤中我们在prometheus.yml添加的。
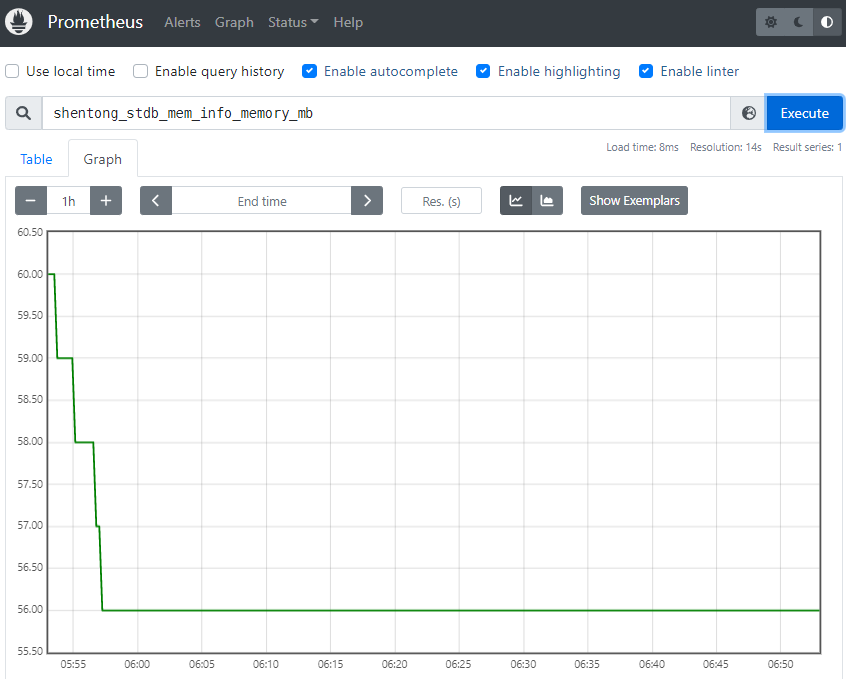
用prometheus查看监控的指标
浏览器中输入:http://192.168.101.86:9090/graph,然后在搜索框中输入“指标”,点击Execute,展示区域切换到Graph,就能看到指标的时间序列图了。